Permit Webmaps User Guide
We have 2 Webmap applications the public can use to view permit information. Learn how to use them in this user guide.
On this page:
About Permit Webmaps
Permit Webmaps display all current permits, applications and tenders for petroleum and minerals. The petroleum webmap also shows petroleum wells.
The information in the webmaps comes from our online permitting system and the GIS database.
Permit Webmaps work best on Google Chrome, Firefox and the latest version of Internet Explorer.
How to find information
Using the search bar
The search bar at the top of the map lets you search for any map content, including by:
- permit number
- company or operation name
- place name
- regional council.
You can search within a specific layer using the dropdown menu beside the search bar.
After pressing search, the results will appear in the pop-up panel.
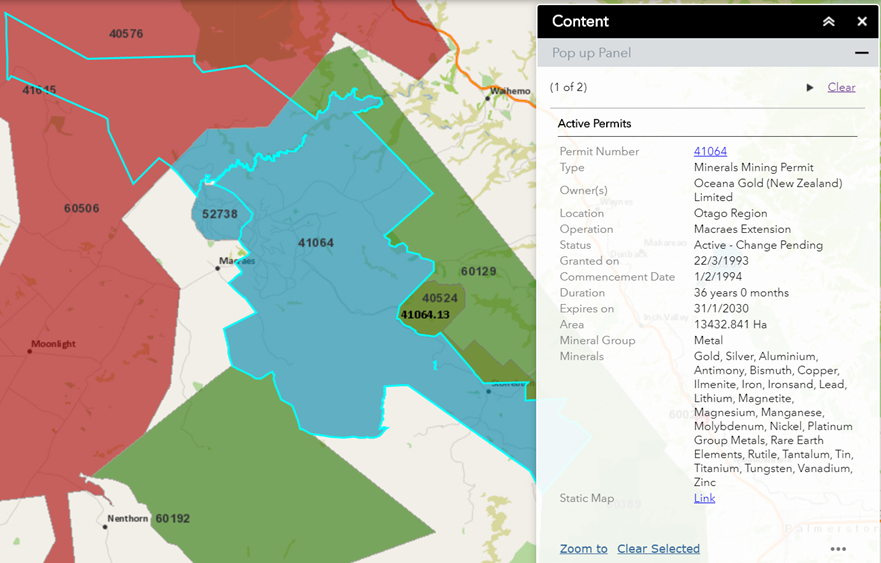
This image shows the pop-up panel that will appear. It lists some of the key information about that area selected. This includes the permit number, type of permit, owner(s), location, operation, status and information about the permit dates and minerals involved.
To see more detailed information, including permit certificates, click on the blue permit number.
You can also use the ‘Static map’ link to generate a printable map of the permit.
The 3 dots in the bottom right of the pop-up panel will open a menu of additional actions, such as exporting the selected permit information to a CSV or JSON format.
Changing the style of map
You can change the style of the map through the Basemap Gallery menu. This can be found under the search bar. It is the icon with 4 boxes.
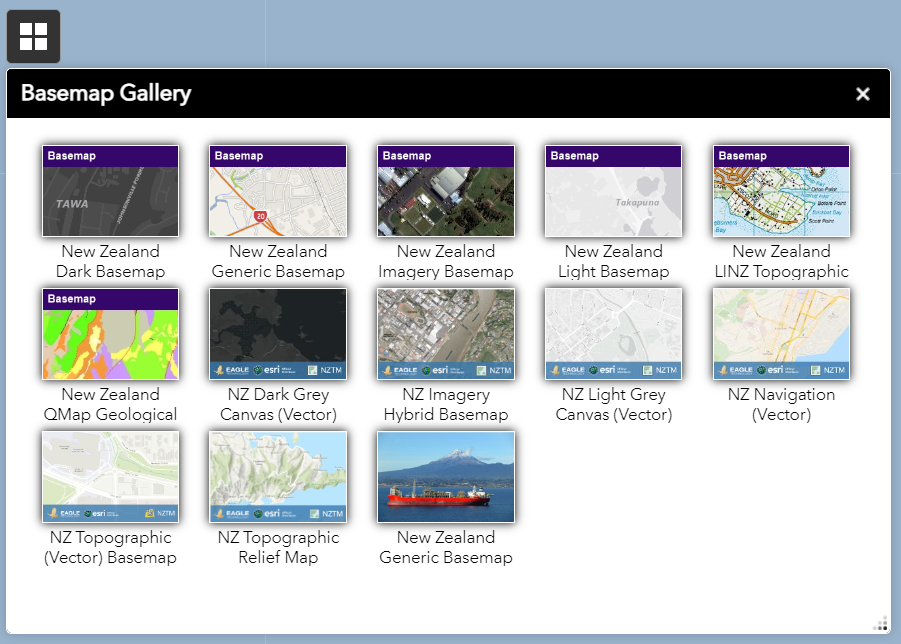
This image shows Basemap Gallery icon in the left of the screen. It also shows the options in the Basemap Gallery panel.
In the top row the options are: New Zealand Dark Basemap, New Zealand Generic Basemap, New Zealand Imagery Basemap, New Zealand Light Basemap and New Zealand LINZ Topographic.
In the middle row the options are: New Zealand QMap Geological, NZ Dark Grey Canvas (Vector), NZ Imagery Hybrid Basemap, NZ Light Grey Canvas (Vector) and NZ Navigation (Vector).
In the last row the options are: NZ Topographic (Vector) Basemap, NZ Topographic Relief Map and New Zealand Generic Basemap.
How to get around the map
Use the mouse wheel or the plus and minus buttons to zoom in or out, or double click on an area of interest.
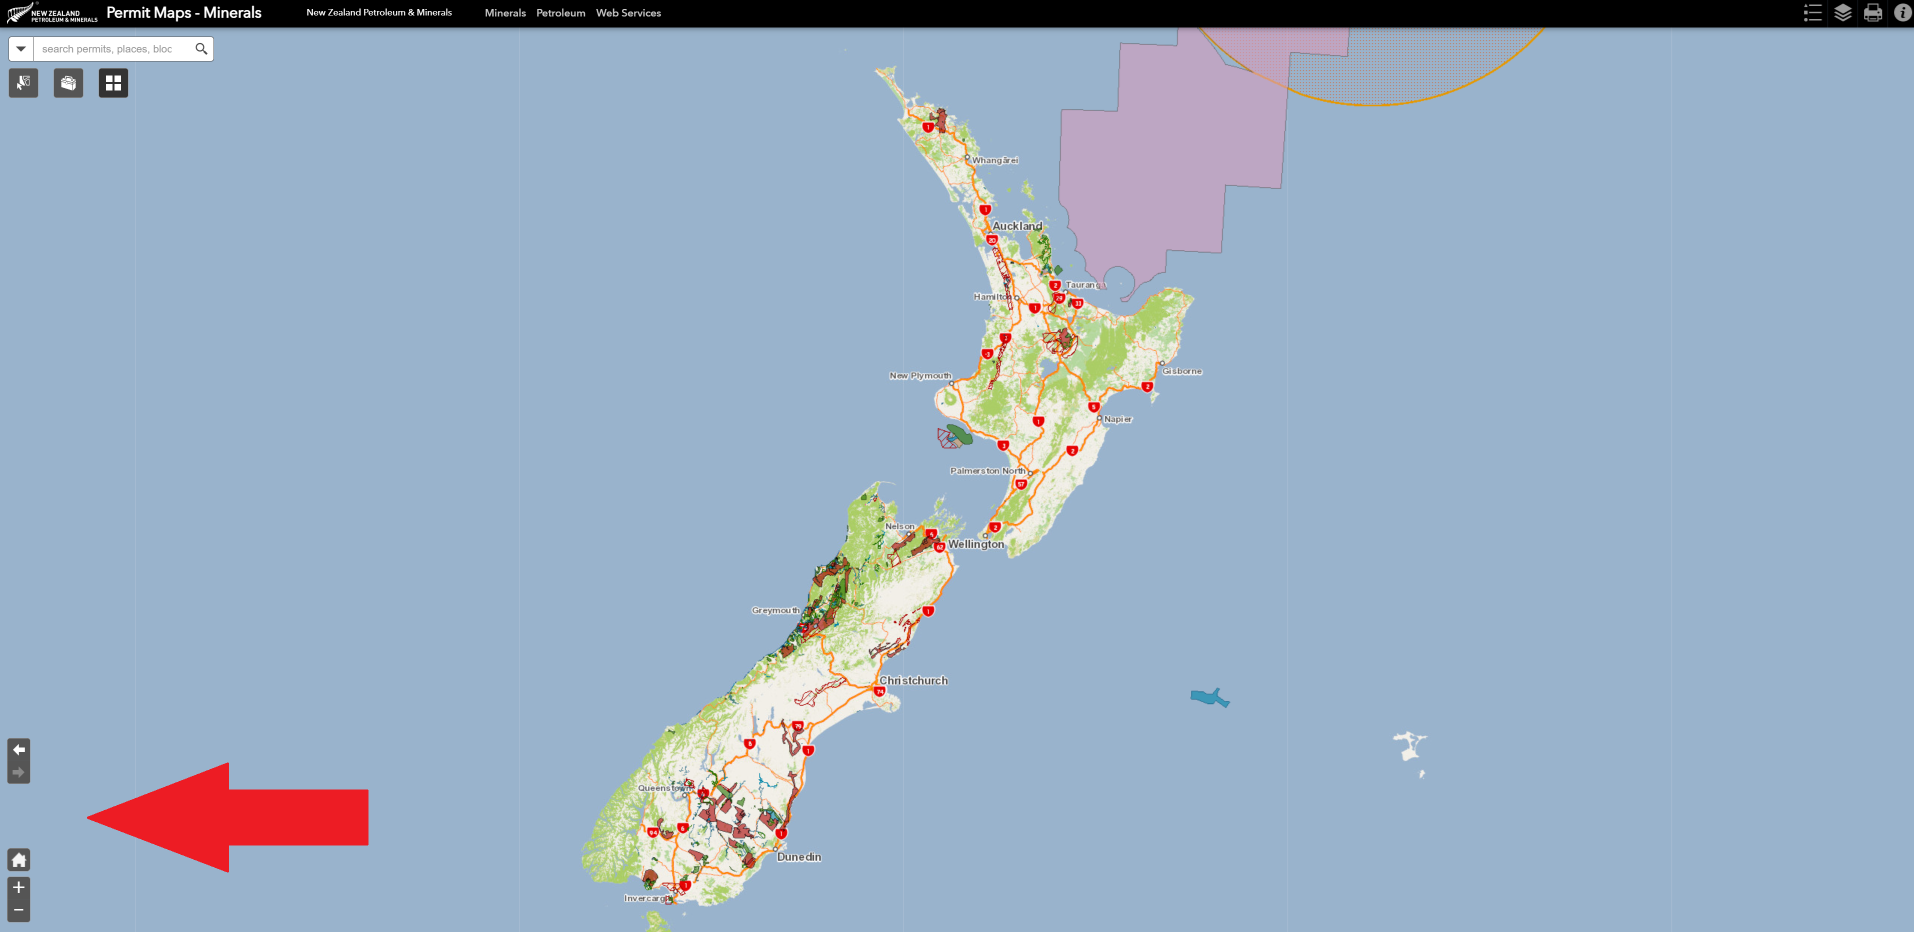
This image shows the map view of New Zealand with a red arrow pointing to the zoom and extent options for the map.
Click, hold and drag the mouse to pan the map.
The forward and back arrows on the lower left side of the screen let you go through the views you’ve zoomed or panned the map to.
The plus and minus icons will zoom the map in and out.
To return to the full map, click on the Home icon.
Selecting data
You can select features within on or more layers by clicking on the select tool. This can be found under the search bar. It’s the icon that looks like a map with an arrow in it.
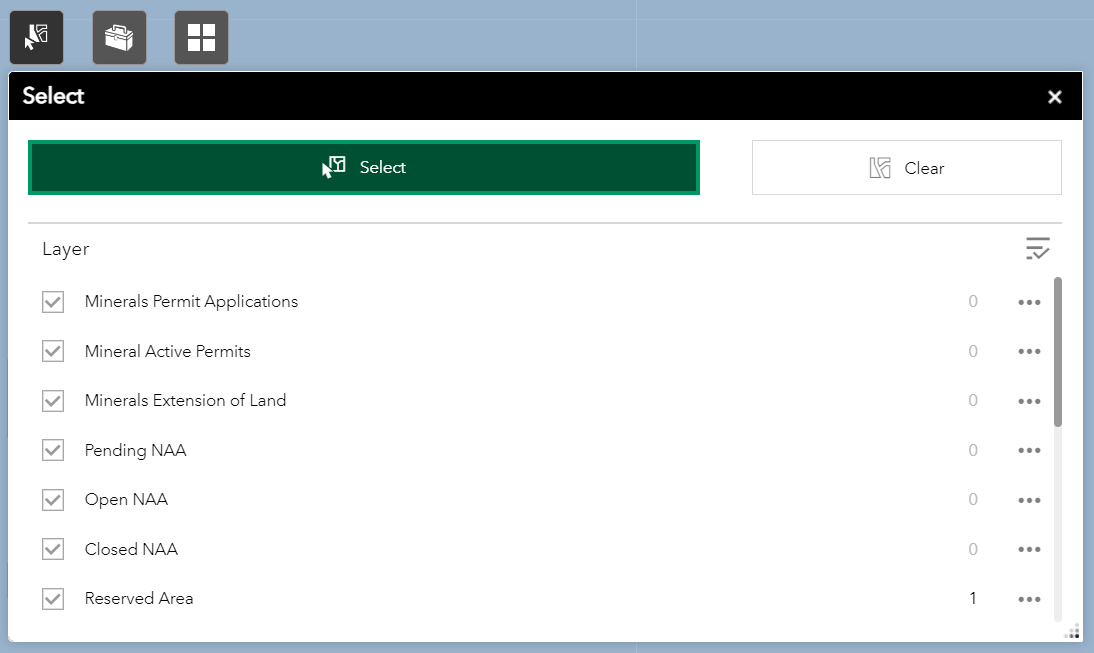
This image shows the select icon in the top left of the screen. It also shows the ‘Select’ panel that has the options available to query. These include minerals permit applications, mineral active permits, minerals extension of land, pending NAA, open NAA, closed NAA and reserved area. On the right side of each option are the three dots you can click to display available actions for the selected features.
Specify the layer(s) you want to query and click and drag across an area of interest to select all features.
Once you have made a selection, click the three dots on the righthand side of the select menu to display available actions for the selected features. These include:
- zooming or panning to the selected features
- generating statistics for the selection
- setting the selection as the input for the Extract Shapefiles tool.
How to download data
How to extract shapefiles
You can extract shapefiles by clicking on the toolbox icon. This can be found under the search bar. The icon looks like a toolbox.
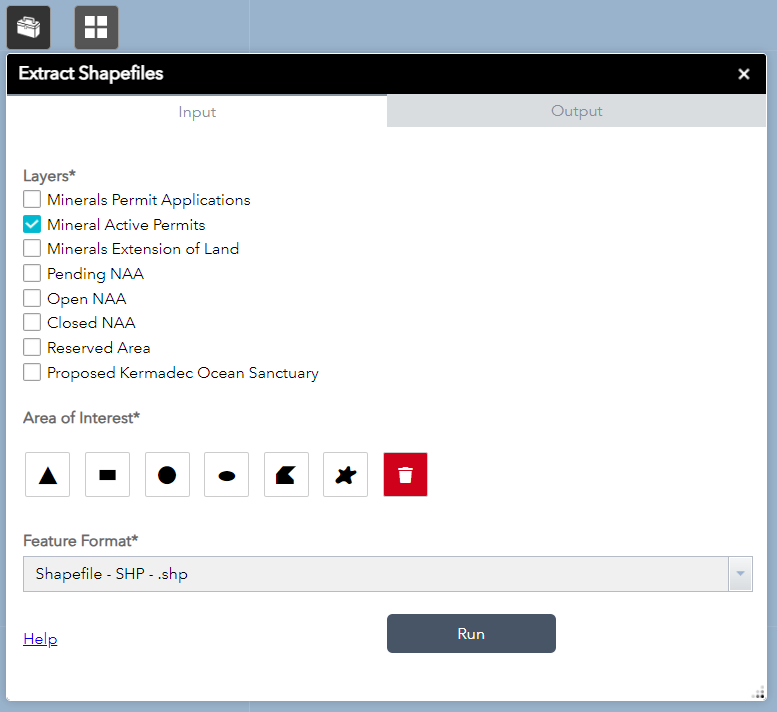
This image shows the toolbox icon in the top left of the screen. It also shows the ‘Extract Shapefiles’ panel where you can select the layers and area of interest. The ‘Run’ button is in the bottom right of the pop-up screen.
Select the layer(s) and an area of interest, then click ‘Run’ to generate a zipped shapefile that contains the data.
To extract a single feature as a shapefile, you can select the feature in the map and open the additional actions menu at the bottom of the pop-up panel.
The ‘Set as input of Extract Shapefiles’ option will set the tool to export that specific feature.
How to extract all data from the map
To extract all data from the webmap, click the information icon in the top right corner of the map. The icon is an ‘i’ in a circle and is next to the printer icon.
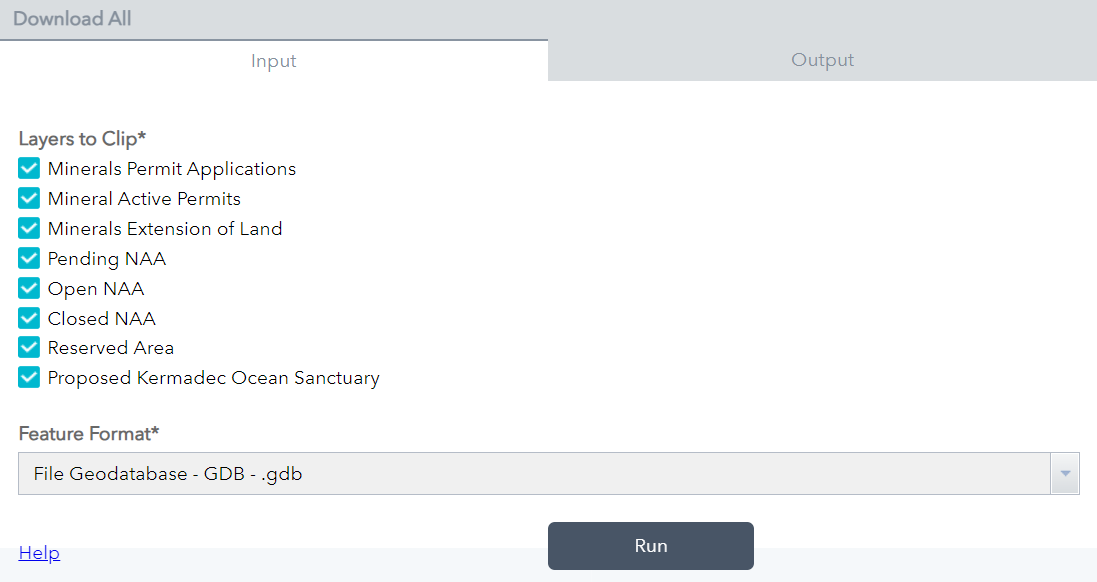
This image shows the ‘Download All’ tool that appears in the ‘About’ panel. There is a field to set the file type for your download. The ‘Run’ button is in the lower right side of the panel.
The ‘Download all’ tool will appear below the ‘About’ panel.
Set a file type for your download and click the ‘Run’ button.
How to view data in Excel
To view data from the webmap in Excel, download the data shapefiles you want using one of the above methods (see ‘How to extract shapefiles’ and ‘How to extract all data from the map’).
Open the downloaded content in Windows Edge.
A shapefile is made up of files. The ones with .dbf at the end of the file name can be opened in Excel.
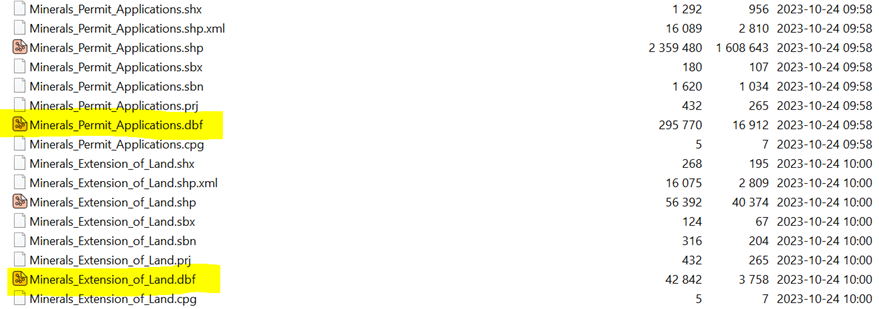
This image shows a list of downloaded files. It highlights the file names that have .dbf at the end of the file name.
How to print maps
To create a printable version of the map you are viewing, click on the printer icon in the upper right of the webmap.
You can choose from a range of map templates and file formats to print.
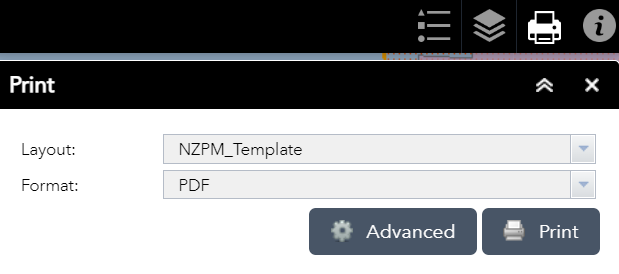
This image shows the printer icon in the right of the screen. It shows the Print pop-up screen where you can choose the layout and format to print in. There are buttons under these to go to advanced settings or to print.
To print a map of a single permit, along with the details of that permit, select the permit in the map and then click the ‘Static map’ link at the bottom of the pop-up panel. A new browser tab will show the map of the selected permit.
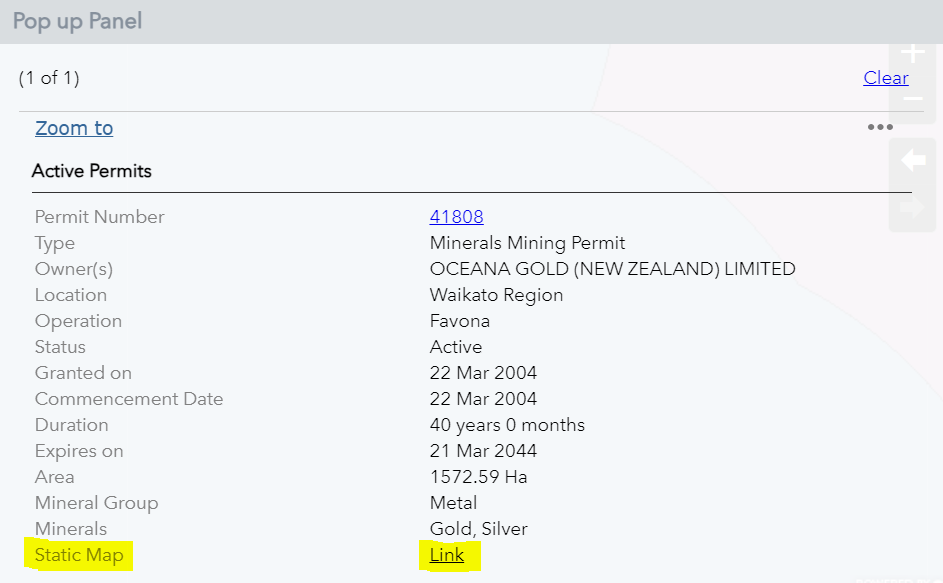
Image shows where the static map link is on the bottom of the pop-up panel.
Then select the printer icon in the upper right of the webmap.
Using web services
Use this guide to find out how to use a range of datasets New Zealand Petroleum and Minerals publishes as a web service.
Support and feedback
For support, or to provide feedback, contact NZP&M.